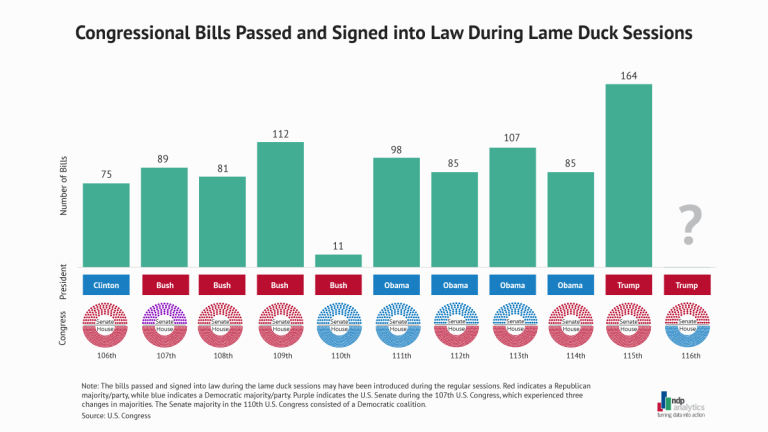
Congressional Bills Passed & Signed into Law During Lame Duck Sessions
November 20, 2020
Every two years when the House and part of Senate change hands, the lameduck session in Nov.-Jan. leaves its own legacy.
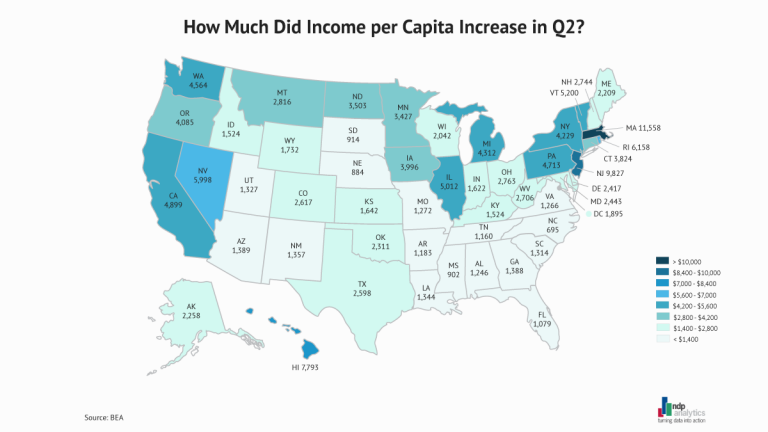
How Much Did Income per Capital Increase in Q2
October 23, 2020
Personal income per capita grew in 2Q20, across multiple states.
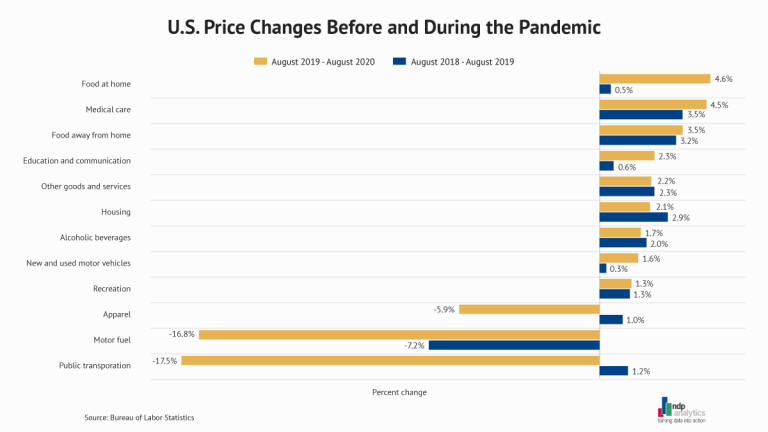
U.S. Price Changes Before & During the Pandemic
September 18, 2020
Prices have changed a lot in the last year as compared to the year before.
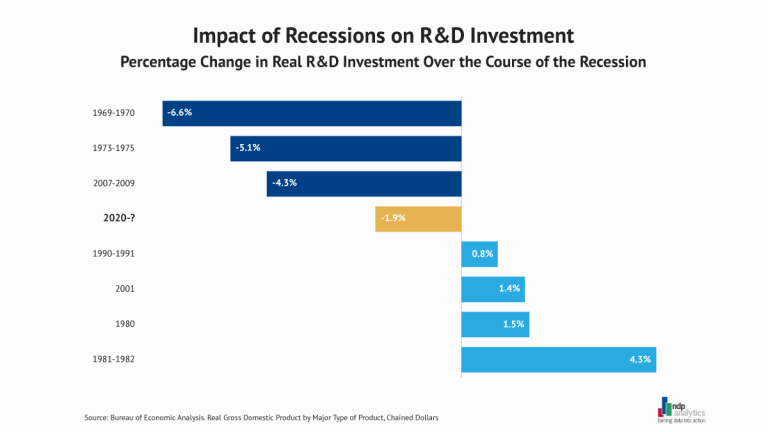
Impact of Recessions on R&D Investment
August 28, 2020
Recessions’ impact on R&D has varied over the years.
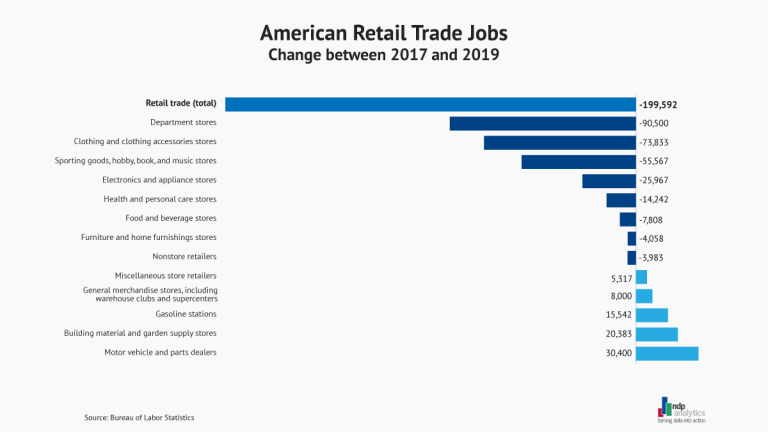
Retail Sales Through COVID-19
July 30, 2020
Monthly retail sales data provide some interesting insights into consumer buying patterns during the pandemic.
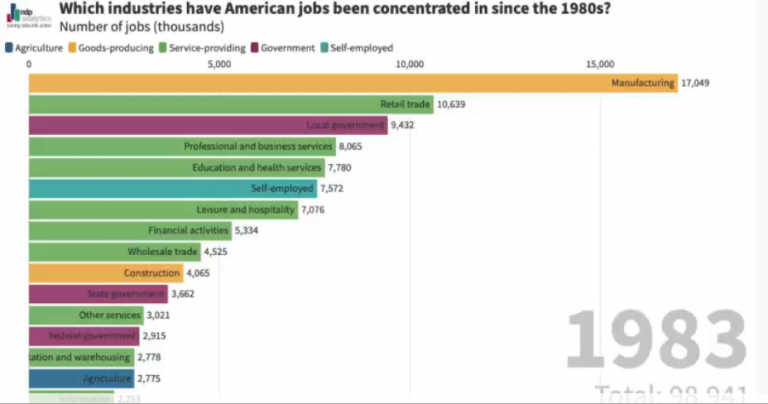
Job Concentration by Industry Since 1983
July 2, 2020
American jobs have changed sectors over the last several decades.